飞书集成平台 x Grafana:打造监控告警系统全攻略

Grafana告警内容设置
告警内容分为:告警标题、告警说明、告警详情。告警标题和告警说明用来描述告警的规则。告警详情,描述告警的规则和具体的值。
告警详情 Description 设置
- 打印所有的标签
{{ $labels }}

alertname=High CPU usage, grafana_folder=CPU alerts, instance=server1- 自定义格式化打印所有的标签
{{ range $k, $v := $labels -}}
{{ $k }}={{ $v }}
{{ end }}

alertname=High CPU usage
grafana_folder=CPU alerts
instance=server1- 打印单个标签
The host {{ index $labels "instance" }} has exceeded 80% CPU usage for the last 5 minutes

The host server1 has exceeded 80% CPU usage for the last 5 minutes- 打印具体的值
{{ index $values "A"· }}

81.2345- if - else 的使用
{{ if (gt $values.A.Value 80.0) -}}
high
{{ else if (gt $values.A.Value 50.0) -}}
medium
{{ else -}}
low
{{- end }}- 其他格式化函数
函数 | 函数名 | 示例 | 输出 |
args | {{define "x"}}{{.arg0}} {{.arg1}}{{end}}{{template "x" (args 1 "2")}} | 1 2 | |
externalURL | {{ externalURL }} | https://example.com/grafana | |
graphLink | {{ graphLink "{\"expr\": \"up\", \"datasource\": \"gdev-prometheus\"}" }} | /explore?left=["now-1h","now","gdev-prometheus",{"datasource":"gdev-prometheus","expr":"up","instant":false,"range":true}] | |
humanize | 易读 | {{ humanize 1000.0 }} | 1k |
humanize1024 | 易读 1024 | {{ humanize1024 1024.0 }} | 1ki |
humanizeDuration | 易读 时长 | {{ humanizeDuration 60.0 }} | 1m 0s |
humanizePercentage | 易读 百分比 | {{ humanizePercentage 0.2 }} | 20% |
humanizeTimestamp | 易读 1024 | {{ humanizeTimestamp 1577836800.0 }} | 2020-01-01 00:00:00 +0000 UTC |
match | {{ match "a.*" "abc" }} | true | |
pathPrefix | {{ pathPrefix }} | /grafana | |
tableLink | {{ tableLink "{\"expr\": \"up\", \"datasource\": \"gdev-prometheus\"}" }} | /explore?left=["now-1h","now","gdev-prometheus",{"datasource":"gdev-prometheus","expr":"up","instant":true,"range":false}] | |
title | {{ title "hello, world!" }} | Hello, World! | |
toLower | {{ toLower "Hello, world!" }} | hello, world! | |
toUpper | {{ toUpper "Hello, world!" }} | HELLO, WORLD! | |
reReplaceAll | {{ reReplaceAll "localhost:(.*)" "example.com:$1" "localhost:8080" }} | example.com:8080 |
详见文档:
飞书集成平台
可以认为是一套开发可用的“低代码平台”,在本案例中,做了以下几个步骤:
- 触发器接受 grafana 的告警
- 从“值班”多维表格中获取今天值班人员信息
- 使用 javascript 预处理告警信息,包括:标题、内容、runbook、值班人员等
- 根据告警类型信息选择不同的飞书消息卡片模板
- 结合模板和数据,发送到告警群(可在集成平台中配置)
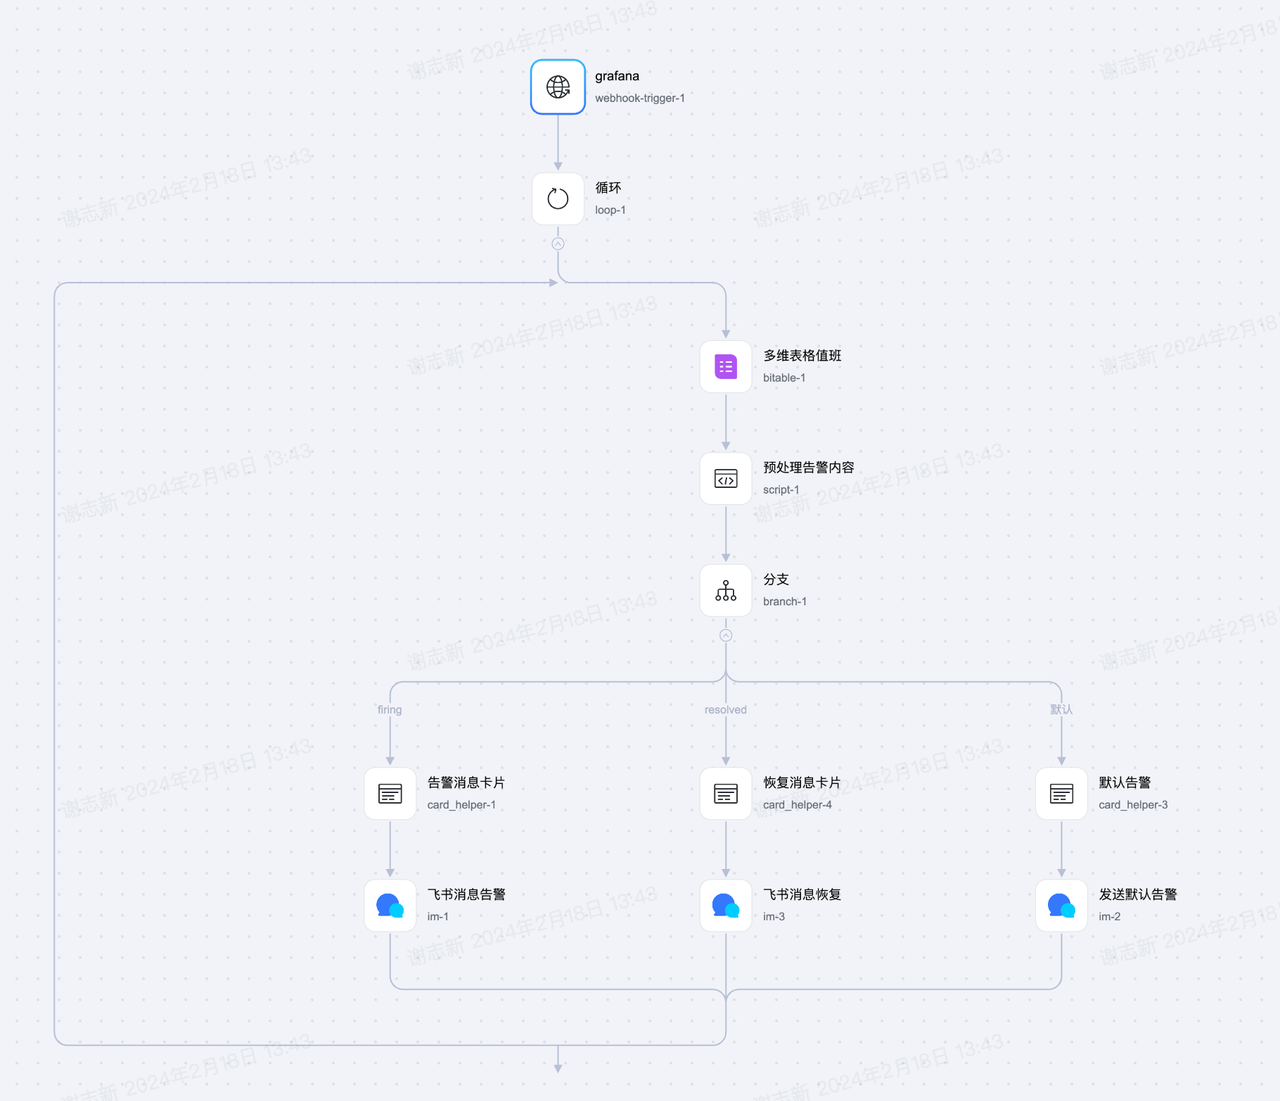
飞书集成平台的触发器提供一个回调地址,将地址填写到 grafana 联络点,选择 webhook 完成设置。